

SWAT is a software trace tool developed by TASKING, that works with SAFERTOS®. When used in combination you gain insights into the runtime behavior of your embedded system.
Get complete visibility into SAFERTOS® applications running on SoCs—all without the need for dedicated hardware trace support. Solve complex timing issues in a fraction of the time, optimize your design, and accelerate your time-to-market.
SWAT provides:
- No hardware redesign needed
- Works with existing setup, no added complexity.
- Minimal impact on system timing
- Avoids interrupt disabling and idle loop instrumentation.
- Flexible streaming duration
- Allows long recording sessions.
- Synchronized trace data
SWAT trace can be synchronized with additional hardware trace sources such as SoCs, CAN/LIN, ADIO, mDIO, providing a holistic view of system behavior.
- High performance
- BlueBox debugger is SWAT-aware and enables monitoring of events with high frequency, while reducing target ECU load.
How SWAT Works
Set it up
Integrate the SWAT library into your application. This will allow your software to generate SWAT trace events during runtime.
Record
The SoC generates trace events and logs them to onboard memory. These events are then transmitted via the standard debug port to the BlueBox debugger.
BlueBox acts as a hardware bridge between the target system and the PC. It captures SWAT trace data from the debug interface and forwards it to the host system.
Analyze
On the PC, winIDEA—an integrated development environment for debug and trace—captures the trace data streamed by BlueBox, processes it, and enables intuitive visualization and analysis.
SAFERTOS® Scheduling analysis
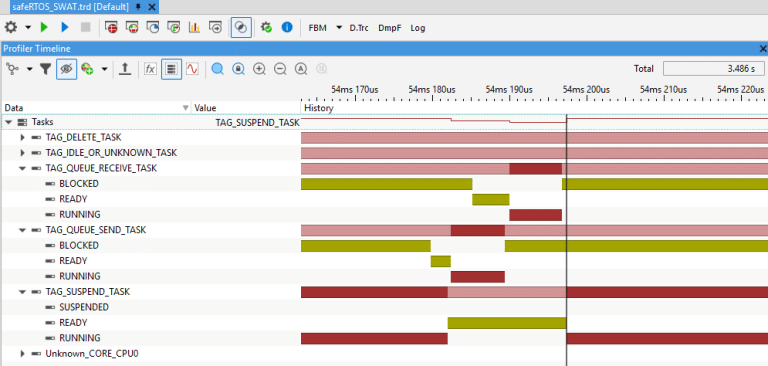
The profiler timeline shows all recorded system activity over time.
It displays all operating system tasks and shows, at any given moment, whether a task is running, ready, blocked, or suspended—and for how long.
This provides a clear overview of what is happening across multiple cores of your SoC, helping you quickly identify and analyze timing behavior.
CPU load and resource usage
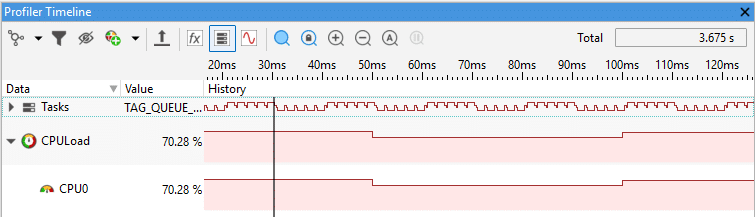
Analyze how processing time is distributed across tasks and cores, detect high-priority task interference, identify execution bottlenecks, and recognize missed scheduling opportunities.
Timing metrics
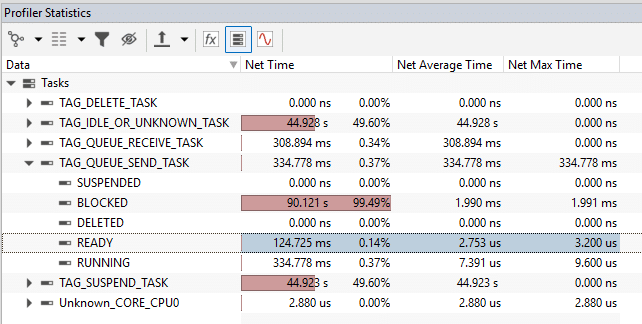
Extract timing relevant metrics and statistics, including net, gross, call, and period times, to understand detailed execution behavior.
Monitor execution timing and periodicity, and uncover timing anomalies such as jitter or subtle delays in periodic tasks—insights that are critical for safety-sensitive systems.
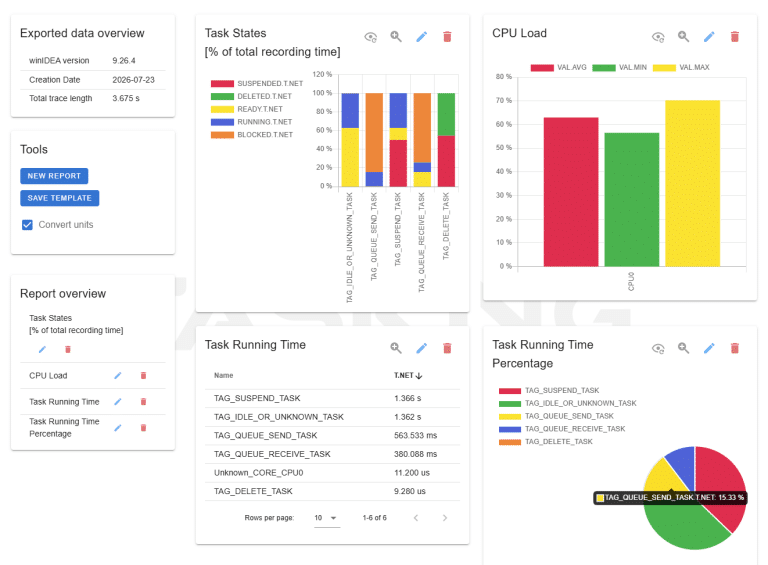
Customizable reporting and analysis
Generate configurable HTML reports directly in winIDEA to demonstrate timing compliance, CPU load, and task behavior for stakeholders, management, or customers.
Trace data can be exported in formats such as BTF and MDF4, enabling integration with third-party analysis tools.
For advanced workflows, export data in formats such as CSV and use the winIDEA SDK to automate testing procedures and perform custom analysis of trace recordings.
Keep exploring with our latest blog post.
Ask Us a Question
For pricing, licensing, or any other sales or product related questions, please contact us.
